
3D visuals can raise conversions, reduce returns, and lower content costs, but to truly maximize ROI, online retailers should reuse 3D assets across channels. This guide provides 3D e-commerce uses, examples, metrics, and an ROI calculator.
Inside this article:
- 3D e-commerce use cases
- Examples of 3D e-commerce driving ROI
- 3D e-commerce ROI calculator
- Key 3D e-commerce ROI metrics to track
- 3D e-commerce ROI benchmarks
- How to increase 3D e-commerce ROI
Quick summary:
3D visuals can improve e-commerce ROI by helping online retailers improve conversions, lessen returns, and create product content more efficiently. The biggest gains often come from using a single 3D asset across product pages, configurators, room planners, AR, and marketing content, rather than treating each experience as a separate project. This guide explains where 3D creates measurable value, which retail use cases tend to deliver the best returns, which metrics to track, and how retailers can build a more credible business case for both revenue lift and operational efficiency. It includes an ROI calculator.
How 3D visuals improve e-commerce ROI
3D visuals improve e-commerce ROI through three primary levers: increasing conversion rates, reducing expensive returns, and lowering content production costs over time. By reusing assets across channels, retailers drive revenue growth while improving operational efficiency in complex categories.
The 3D Commerce Index Q1 2026 provides the benchmarks below across 40 major retailers representing over $10B in annual 3D commerce sales. While the findings from 3D Cloud’s research focus on the furniture and home categories, the results show how 3D addresses visual complexity and return risk across any high-consideration industry.
Lever 1: Accelerated revenue and conversion from 3D visuals
The most immediate ROI comes from moving shoppers from browsing to buying by providing a clearer sense of form, detail, and scale.
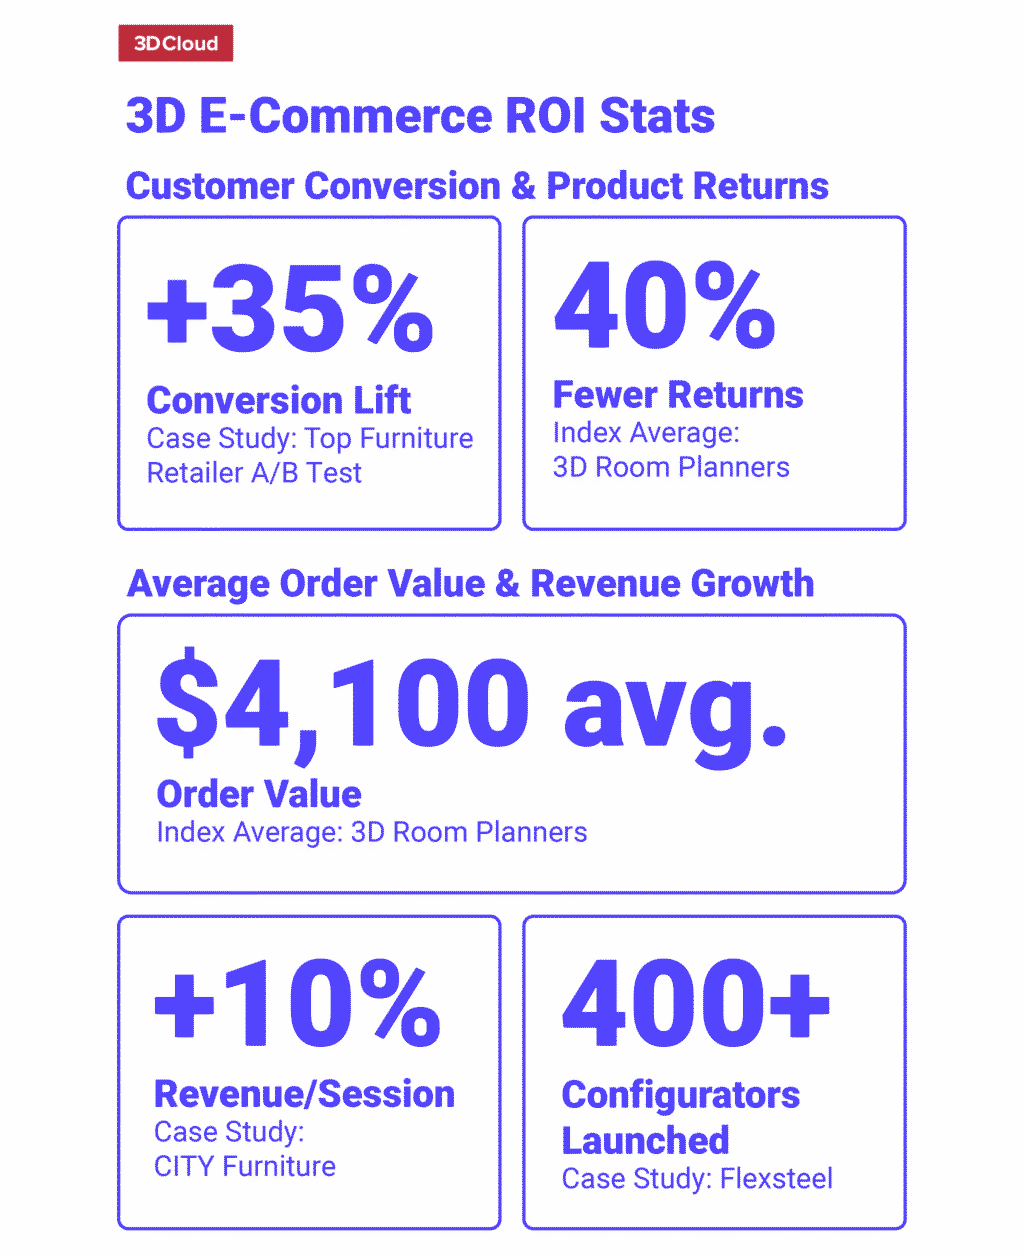
- Direct sales lift: In a 50/50 A/B test of 220,000 PDP views for a top furniture retailer, shoppers who interacted with 3D spins or AR converted 35% more than standard users.
- Higher order value: On average across the 3D Commerce Index, 3D room planners support an average order value of $4,100.
- Category growth: Targeted implementations have shown immediate impact; for example, the use of a sectional configurator by one furniture company led to an 8.6% lift in revenue.
Lever 2: Substantial return reduction from 3D commerce
Returns are a critical cost-side ROI lever, particularly for larger items where shoppers must judge fit and scale in their own space.
- The Index average: Index data across major retailers shows that 3D room planners have an average 25% reduction in returns.
- Top performance: Brands that integrate advanced room-scanning technology, such as Joybird, have pushed these savings even further, achieving a 40% reduction in returns.
Lever 3: Operational efficiency via 3D visual asset reuse
The most durable ROI comes from treating 3D as reusable infrastructure that powers multiple experiences without repeating production work.
- Rapid scale: Centralizing 3D visualization allows for massive deployment; Flexsteel successfully launched over 400 product configurators across 1,300 dealers in under one year.
- Revenue per session: Streamlining 3D content can directly improve the value of every visitor. By unifying its 3D operations, CITY Furniture recorded a 10% increase in revenue per session on its configurable pages.
The strongest ROI use cases usually come from stacked gains, not one headline metric.

"Asking about ROI on 3D ecommerce applications is like asking about the ROI of putting prices on your products. If you sell configurable products online, 3D visual configuration isn't a nice-to-have. It's the cost of doing business," said Beck Besecker, CEO and Co-Founder of 3D Cloud. "Of course, we partner with some very smart retailers who A/B test everything and there's a compelling story for individual 3D applications."
"For instance, we've seen up to 10% more revenue per session on our Modular and Sectional Configurators, directly attributed. But that's just the floor," Besecker noted. "The real ROI story is 3D asset reuse. When the same product and material content works across multiple applications, that's where the compounding kicks in."
 3D e-commerce use cases
The highest-value 3D e-commerce use cases are the ones that solve a specific buying problem or content bottleneck. In 3D Cloud’s research, the strongest results come from experiences tied to fit, scale, configuration, room planning, and asset reuse rather than from adding 3D as a novelty feature.
Prime use cases of 3D visuals include:
- Product detail page 3D viewers and 360° spins: This is often the most practical entry point for online retailers because it improves product pages without forcing a major workflow change. It works best when shoppers need a better view of form, detail, or construction before buying.
- Web-based augmented reality (AR): AR tends to create the most value when shoppers need help judging fit, scale, or placement in a real space. It is especially useful for products that are hard to evaluate accurately through flat images alone.
- Product configurators for variant-rich products: Configurators are often higher-value than simple viewers because they help shoppers move from browsing to decision-making. They are most useful for assortments with multiple materials, finishes, sizes, or feature combinations that would otherwise be cumbersome to shop online.
- Modular and sectional configurators: For modular furniture and sectional categories, the configurator can become the primary shopping interface rather than an add-on. This use case is especially strong when shoppers need to build a product around room size, layout, or personal preferences before they feel ready to buy.
- 3D room planners: Room planners tend to create value through high-intent behaviors rather than quick interactions. They are most effective for retailers selling room-based assortments, where shoppers need help understanding layout, spacing, and how multiple pieces work together before making a purchase. See more on measuring ROI for a 3D room planner investment.
- Virtual photography and render generation: This use case is often less visible to shoppers, but it can be one of the most important for ROI. Once a product is modeled and approved, retailers can use that same 3D asset to generate spins, lifestyle renders, variant imagery, and other visual outputs without repeating a traditional photo workflow. See details on 3D rendering and how to create 3D product images and models.
- Cross-channel asset reuse: The highest-value use case is often not a single front-end experience at all. It is the ability to use one governed 3D asset across PDPs, AR, configurators, sales tools, marketplace content, and the broader digital shelf.
For more, see our guide to 3D e-commerce.
Examples 3D e-commerce driving ROI
The strongest examples of 3D e-commerce ROI come from retailers that use 3D to solve a specific commercial problem.
CITY Furniture: combining sales impact with content efficiency
CITY Furniture is a useful example because it shows how 3D can create value on both the customer-facing and operational sides of retail. Rather than using 3D only as a visual upgrade, the retailer built it into a broader commerce workflow. That kind of approach can improve the customer experience while also helping teams scale and manage content more efficiently.
In a 3D Cloud case study with City Furniture, the retailer improved its ROI by implementing unified 3D operations, consistent 3D content across all channels, faster product launch cycles, and content updates. It saw higher engagement, conversion, and revenue performance, including a 10% increase in revenue per session on configurable collection pages.
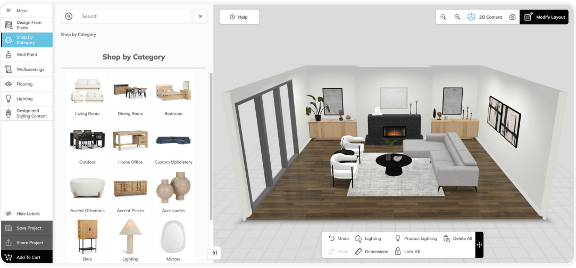
City Furniture’s 3D room planner using 3D Cloud technology.
Flexsteel: making customization scalable
Flexsteel, an Iowa-based furniture manufacturer with over 1,300 dealers nationwide, sells products with multiple materials, finishes, and configurations. By centralizing and scaling product visualization with the 3D Cloud Platform, Flexsteel replaced complex, labor-intensive processes with a scalable, unified 3D product visualization solution.
In 3D Cloud’s case study with Flexsteel, the furniture company deployed over 400 configurators across consumer and dealer channels in less than a year, driving tens of thousands of monthly sessions with a nearly 3-minute average session time, all managed by a single non-technical marketing specialist.
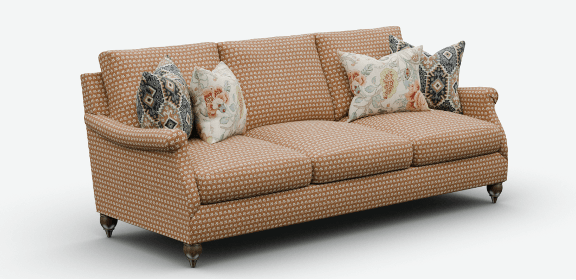
4k couch render from the Flexsteel product configurator app, powered by 3D Cloud.
HNI: improving specification and quoting for complex products
HNI Corporation, the company behind well-known office furniture brands HON, Allsteel, and Kimball, uses over 400 3D Cloud product configurators. They make it easier for dealers to show and configure products, build quotes, and place orders. In categories where buying decisions involve more configuration and coordination, those efficiencies can matter as much as direct conversion lift.
As the 3D Cloud case study with HNI illustrates, this level of scale allows HNI to support brand-specific dealer portals and customer experiences, maintain consistent 3D content across different websites, and reuse assets and logic to speed up deployment for new product families.
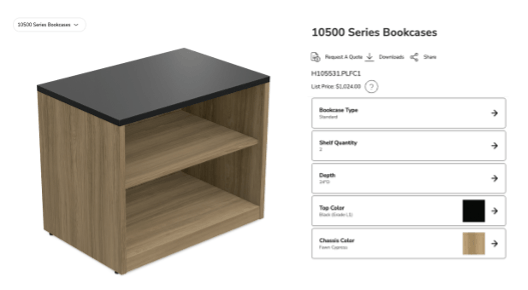
HNI product configurator that allows dealers to request a quote with ease.
Top industries for 3D e-commerce
3D e-commerce tends to deliver the strongest ROI in categories where shoppers need help judging fit, scale, configuration, or visual detail before they buy. In 3D Cloud’s published research and case studies, the deepest evidence base is in furniture and adjacent home categories, but the same value drivers also apply in automotive, fashion, jewelry, and other visually complex product categories.
- Home furniture: Furniture is one of the best-documented categories for 3D e-commerce ROI because shoppers often hesitate over dimensions, proportions, finishes, and how a product will look in their space. That makes 3D viewers, AR, configurators, and room planners especially useful for improving purchase confidence, increasing conversion, and reducing avoidable returns.
- Office furniture: Office furniture is another strong fit because products often involve more specification, configuration, and quoting complexity than standard consumer goods. In this category, 3D can support both self-serve shopping and sales-assisted buying by helping buyers compare options, understand product details, and move through more complex decisions with less friction.
- Kitchen and bath: Kitchen and bath remodeling products are well-suited to 3D because shoppers rarely buy a single item. They are often planning around a space, a design scheme, or a broader renovation project. In these categories, 3D planning tools can help shoppers work through layout, finishes, and product combinations to support both confidence and higher-value purchases.
- Storage and closets: Storage and closet systems are strong candidates for 3D configuration because the purchase depends on dimensions, layout, and customization. Shoppers need to understand how pieces fit together, how the final setup will function, and whether the design works in a specific space. That makes guided planning and configuration especially valuable.
- Decking and outdoor living: Decking and outdoor categories also lend themselves well to 3D because shoppers often need to visualize projects before they commit. Materials, layouts, finishes, and overall design all affect the purchase decision. In these categories, 3D can help retailers support project planning while reducing the uncertainty that slows online conversion.
- Automotive: Automotive is a natural fit for 3D because shoppers often want to compare trims, colors, packages, and features before visiting a dealership or making a purchase decision. The ROI case here usually centers on configuration, decision support, and lead quality rather than on a simple product-page lift. When products involve many options, 3D can make the complexity easier to handle.
- Fashion: Fashion can benefit from 3D when it helps shoppers evaluate style, detail, materials, or customization more confidently. The strongest applications are usually product visualization, virtual try-on, and personalized configuration rather than room-planning-style tools. In a category where appearance drives purchase decisions, better visualization can help reduce hesitation.
- Jewelry: Jewelry is another category where 3D can support online buying because small visual details, finishes, scale, and personalization matter so much. Shoppers often want a closer, more realistic sense of the product before purchasing. 3D can help retailers present intricate products more clearly and support big ticket, high-consideration purchases.
The industries that benefit from 3D ROI usually share the same underlying challenges. The highest ROI on 3D experiences is for expensive, low frequency purchases that involve many incremental choices. For these types of purchases, shoppers need more confidence before they buy, products are difficult to evaluate in static images, and retailers benefit when the same 3D asset can support multiple selling and merchandising experiences. That is why 3D tends to create the most value in categories shaped by fit, configuration, planning, and visual detail.
Read more on how to build a business case for a 3D e-commerce project.
Key 3D e-commerce ROI metrics to track
To measure 3D e-commerce ROI credibly, track the metrics that match the user experience. A product page viewer should not be judged the same way as a room planner or configurator. The purpose is to connect 3D activity to revenue, returns, and content efficiency, rather than treating all engagement as equal.
Conversion rate
Conversion rate is still one of the most important metrics for many retailers, but it needs context. Track product detail page conversion, add-to-cart rate, and checkout completion, then compare shoppers who used the 3D experience with similar shoppers who did not. The cleanest way to do this is through an A/B or holdout test rather than a simple before-and-after comparison.
Formula: Conversion rate = Orders divided by sessions
Add-to-cart rate
Add-to-cart rate is especially useful for modular configurators, large furniture, and other high-consideration products where the buying process has several steps. In some categories, add-to-cart moves sooner than final conversion, which makes it a strong leading indicator.
Revenue per visit
Revenue per visit is one of the best summary KPIs because it captures both conversion and basket size. This is often more useful than conversion rate alone when 3D affects both whether shoppers buy and what they buy. When 3D improves revenue per visit, it can also improve media efficiency by helping retailers generate more value from the same traffic and customer acquisition cost.
Formula: Revenue per visit = Total revenue divided by sessions
Average order value
Average order value helps retailers measure whether 3D encourages shoppers to choose higher-end materials, better configurations, or larger purchases. This matters most in categories with meaningful upgrade paths, such as configurable furniture, office furniture, and room-based assortments.
Formula: Average order value = Revenue divided by orders
Return rate and cost per return
Return rate is one of the clearest cost-side metrics in a 3D ROI model, but it should always be paired with cost per return. A lower return rate matters more when each return creates meaningful reverse-logistics costs, including shipping, inspection, refurbishing, discounting, or liquidation.
Formulas:
Return rate = Returned orders divided by total orders
Return cost impact = Change in return volume × Estimated cost per return
Usage rate
Usage rate tells you whether shoppers are actually engaging with the experience. This is a critical metric because a strong feature cannot lift results if few people use it. Usage rate is especially important for PDP viewers and AR, where discoverability and merchandising can determine whether the investment pays off.
Formula: Usage rate = Users who interacted with the 3D feature divided by eligible users or sessions
Interaction and completion metrics
Some 3D experiences are better judged by progress through the experience than by raw usage alone. For configurators, track interaction rate, quote creation, saved configuration, or completed design. For room planners, track project save rate, room completion, or a book-a-design action. These metrics show whether shoppers are using the tool to make a decision.
Formulas:
Interaction rate = Users who engaged with feature divided by eligible users
Project save rate = Saved projects divided by planner users
Content operations metrics
Track how much content the team produces, how quickly it gets published, how often assets are reused, and how often content has to be rebuilt or reshot. This is where the single-source-of-truth model starts to show real value.
“The most durable 3D ROI usually comes from removing repeated work from the content pipeline,” says Ryan Wood, Data Scientist at 3D Cloud. “When teams stop recreating the same product in different formats for e-commerce, configurators, marketplaces, and sales tools, they reduce rework, speed up updates, and make every asset more productive.”
Useful content operations metrics include:
- Cost per SKU or asset created
- Time to publish
- Rework rate
- Number of downstream experiences powered per asset
- Percentage of catalog supported by reusable 3D assets
Site performance metrics
Site performance belongs on the scorecard, too. If a 3D experience slows critical pages, the conversion benefit can erode. Track load behavior and interaction performance on 3D-enabled pages to confirm that the experience is smooth.
How to use 3D e-commerce ROI benchmarks
3D e-commerce benchmarks help retailers sanity-check assumptions. The right way to use them is to set realistic adoption and lift ranges, estimate break-even thresholds, and design a pilot that shows whether a specific 3D use case can pay off in your catalog, traffic mix, and operating model.
1. Start with 3D benchmark ranges
The most useful benchmarks show what is plausible, not what will happen in every rollout. That is why 3D Cloud’s 3D Commerce Index is helpful: It breaks out performance by use case rather than offering a single universal “3D ROI” number.
For example, the Index shows that:
- 3D spins and AR averaged a 6.2% PDP usage rate.
- Product configurators averaged a 13% interaction rate.
- Modular configurators averaged a 13.9% add-to-cart rate.
- Room planners averaged a 26.8% project save rate.
Those numbers are best used as directional planning ranges.
2. Use a simple 3D e-commerce ROI formula
Retailers do not need a perfect model to estimate 3D ROI. They need a practical one that reflects the main ways 3D creates value. In most cases, that value comes from three sources: incremental gross profit from better conversion or higher revenue per session, savings from fewer returns, and savings from more efficient content operations.
Formula: ROI = (Total annual 3D value – Total 3D cost) divided by total 3D cost
A practical planning version is:
Formula: Total annual 3D value = Incremental gross profit + Return-cost savings + Content-operations savings
Formula: Payback period = Total 3D cost divided by average monthly incremental profit
3. Focus on the inputs that change the 3D business model the most
3D business cases depend on a series of variables. If those assumptions are unrealistic, the entire model becomes unreliable. The biggest drivers are eligible traffic, feature usage, conversion lift, average order value, return reduction, gross margin, cost per return, and the amount of asset reuse the retailer can actually achieve.
“Two retailers can see similar conversion lift and still have very different ROI outcomes,” Wood says. “The difference often comes down to traffic quality, catalog complexity, return economics, and how many downstream uses each 3D asset actually supports.”
The most important inputs to include are:
- Eligible traffic or sessions
- Expected usage rate
- Expected conversion or add-to-cart lift
- Baseline average order value and gross margin
- Current return rate and estimated cost per return
- Initial 3D creation cost
- Ongoing maintenance cost
- Number of outputs or channels each 3D asset will support
4. Validate assumptions with a 3D ROI pilot
The safest way to estimate ROI is to run a pilot before scaling. A sound experimentation framework helps retailers isolate the impact of 3D from other variables, such as promotions, traffic shifts, and merchandising changes. Strong pilot test design matters because weak comparisons, short timelines, or poorly chosen SKUs can distort the result.
A practical pilot should:
- Use a defined SKU set, ideally bestsellers or a category with clear buying friction
- Compare similar traffic or matched cohorts
- Measure usage, conversion, add-to-cart behavior, return behavior, and content effort
- Run long enough to smooth out seasonality and promotion effects
- Produce a payback estimate based on observed lift, not guessed lift
Quick example:
Consider a retailer piloting a product configurator on a category with 1,500,000 annual PDP views and a 20% usage rate, generating roughly 300,000 configurator sessions. With a 4% add-to-cart rate, a 35% add-to-cart uplift, an $800 average cart value, a 40% contribution margin, and a 30% cart conversion rate, the projected annual incremental profit is $403,200 before factoring in return savings or content-efficiency gains. If those same 3D assets later support AR or virtual photography, the payback period can shorten further.
5. Use a 3D e-commerce calculator as a scenario planning tool
The calculator in the next section is most useful as a scenario planning tool. Because ROI varies by solution type, traffic volume, product complexity, and operating model, adjust the inputs to test a range of assumptions rather than aim for one "correct" number. Use the sensitivity table to identify your break-even threshold before deciding where to run a pilot first.
Try the calculator below.
3D e-commerce ROI calculator
Before adjusting the inputs, note that the calculator uses two distinct models depending on the solution you select.
For product-page and configurator experiences — 360° spins/AR, product configurators, modular configurators, and room planners — the model is built around PDP traffic, usage rate, add-to-cart behavior, average cart value, and contribution margin. These inputs reflect the way shoppers move from browsing to buying on a product page.
For project-planning tools — the kitchen planner and decking planner — the model uses a bill-of-materials (BOM) structure based on session volume, average project value, BOM save rate, and BOM conversion rate. Here, the value isn't a single add-to-cart event; it's a saved project representing a full room or outdoor space that may convert at a lower rate but at a much higher order value. A kitchen retailer with 1,000,000 annual sessions, a $5,000 average BOM, and a 20% BOM save rate, for example, projects $20M in incremental annual revenue at a 5% BOM conversion rate.
Revenue Uplift and ROI Calculator for 3D Commerce Applications (3D Cloud)
Select the 3D commerce solution you are researching. Add your inputs and then adjust the slider to mirror your current or anticipated cart conversion rate. To complete the exercise, contact us for a complimentary ROI analysis that includes the cost of the software.
| Cart Conversion Rate | Incremental Profit |
|---|
3dcloud.com
The future of ROI for 3D e-commerce
The future of ROI for 3D e-commerce will come from making 3D assets more reusable, more intelligent, and simpler to implement in different shopping experiences. Over the next few years, the biggest gains are likely to come less from one new front-end feature and more from combining 3D assets with AI-generated creative, spatial interfaces, and conversational shopping flows.
Here’s a breakdown of 3D e-commerce ROI trends:
- AI-generated creative will likely improve the economics of 3D. AI will make it faster and cheaper to create 3D assets of real products, allowing retailers and manufacturers to maintain comprehensive 3D catalogs. In addition, asset reuse across applications helps retailers create more immersive experiences without producing new content each time. assets to generate more outputs without repeating traditional production work.
- Spatial commerce is another longer-term opportunity, but it should be viewed realistically. Apple’s visionOS 26 update gives web developers the ability to embed 3D models directly into web pages for Safari on Apple Vision Pro, and Apple is positioning spatial browsing and 3D object interaction as part of a broader shopping experience. At the same time, headset adoption remains limited, so spatial commerce is better understood today as an emerging channel and an innovation path than as an immediate mass-market revenue engine.
- AI agents may change the ROI equation more quickly than immersive hardware does. Google has been expanding AI shopping features that help users discover products, compare options, track prices, and even complete purchases with agentic checkout. For retailers, that raises an important question: whether their product data, visual assets, and 3D content are structured well enough to perform inside AI-mediated shopping journeys, not just on their own site.
- Conversational configuration is also becoming more important. Earlier this year, 3D Cloud announced a U.S. patent for AI-powered chat-based product configuration. It lets shoppers describe what they want in plain language and see the 3D product update in real time. For retailers with complex assortments, that could reduce friction and make advanced configuration more accessible.
For online retailers, the strategic takeaway is straightforward: The future ROI of 3D will depend less on launching a single flashy experience and more on owning a flexible 3D asset foundation that can power a full suite of experiences. The retailers that treat 3D as a reusable commerce infrastructure will be in a better to benefit from developments in AI-assisted 3D content creation, conversational shopping, spatial browsing, and whatever comes next.
How to increase your 3D e-commerce ROI
3D Cloud increases ROI by helping retailers treat 3D as reusable infrastructure rather than a one-off feature. With 3D Cloud’s 3D asset management platform, one governed asset can support PDP visuals, AR, configurators, room planners, virtual photography, and other merchandising outputs while supporting 3D workflows.
That matters because the biggest cost in 3D is often not the first launch. It is the repeated work of recreating, updating, and managing product content across systems and channels. A centralized 3D asset management approach can reduce duplication, improve consistency, and make it easier to scale 3D across the business.
“Retailers often compare the cost of a 3D experience to the cost of a photoshoot without comparing the reuse value of the asset behind it,” says 3D Cloud’s Besecker. “Instead, think about 3D asset reuse as a core metric when evaluating solutions. Solving for a single channel or experience can seem faster or easier upfront, but it can be costly down the line. What we've learned is that the way to go is to think bigger and consider the myriad outputs, channels, and customer experiences the same 3D asset can support over time.”
For retailers evaluating 3D platforms, the key question is not just whether a vendor can launch one compelling experience. It is whether that platform can become a single source of truth for 3D content and keep creating value as new channels, use cases, and shopping interfaces emerge.
Schedule a 3D Cloud demo today.
FAQ on the ROI of 3D visuals for e-commerce
How much do 3D product visuals cost per SKU for e-commerce?
The cost of 3D product visuals varies widely based on product complexity, number of variants, level of realism, and intended use. A simple viewer asset costs far less than a configurable product or room-planning model, which is why retailers should model cost by use case, not one universal rate.
How many 3D product visuals (SKUs) are needed for an e-commerce pilot to measure 3D ROI reliably?
One approach is to start with a sectional configurator, which requires fewer SKUs than, say, a 3D room planner. In other verticals, retailers may want a starting point of 500 SKUs, ideally focused on bestsellers or a category with clear buying friction.
Will adding 3D product visuals to e-commerce pages slow page speed?
3D visuals can affect page performance if they are poorly implemented, oversized, or loaded inefficiently. In practice, retailers should measure the impact of page speed directly and optimize delivery. A well-managed experience should balance visual richness with performance.
What ongoing maintenance and costs do 3D product visuals require in e-commerce when products, variants, or materials change?
Ongoing maintenance depends on how often products, options, materials, and assortments change. Costs usually include model updates, new finishes or fabrics, QA, publishing, and governance. Retailers can reduce those costs when they manage 3D assets in a central system.
Which products tend to deliver the strongest ROI from 3D visuals?
3D usually delivers the strongest ROI on expensive, configurable, or visually detailed products. Furniture, office furniture, kitchen and bath, decking, automotive, fashion, and jewelry can all benefit when shoppers need more confidence in fit, scale, finish, or customization.
Is 3D ROI mainly about increasing conversion?
No. Conversion lift matters, but it is only one part of the business case. For many retailers, the more durable return comes from combining shopper-facing gains with lower return costs, faster content production, fewer reshoots, and better reuse of the same 3D asset across multiple experiences.
Should retailers think about headless commerce when planning 3D e-commerce ROI?
Yes, especially if they already run a composable or headless commerce stack. In those environments, 3D ROI depends on both the visual experience and how easily 3D content can be delivered, updated, and reused across storefronts and connected systems.
Does 3D e-commerce ROI change in a multi-storefront environment?
Often, yes. In a multi-storefront environment, ROI can improve when the same governed 3D assets support multiple branded sites, regional storefronts, or dealer experiences. That kind of reuse can reduce duplicate production work and make updates more efficient across the business.
Do asset ownership rights affect the ROI of 3D visuals?
Yes. Asset ownership rights can affect long-term ROI because retailers create more value when they can reuse and adapt 3D assets across channels, campaigns, and future experiences. If usage rights are limited, the return on the original investment may be less than expected.
Can 3D visuals improve performance on multivendor marketplaces?
They can, but the impact depends on the marketplace’s content rules and supported formats. Even when a marketplace does not support the full 3D experience, retailers can still benefit if the same 3D asset helps generate more consistent product imagery, variant views, and digital-shelf content for marketplace listings.
Is bounce rate a useful metric for 3D e-commerce ROI?
Sometimes, but it is usually a secondary metric. Bounce rate can help indicate whether a 3D-enabled page is holding attention better than a standard page, but retailers should treat it as supporting context rather than a primary ROI measure alongside conversion, revenue per visitor, return rate, and content-efficiency gains.