
A 3D product configurator can often pay for itself within months, but a company’s specific ROI depends on its cost and revenue drivers. Try our calculator as a starting point, and get a slide deck on how to make the business case for your organization.
Inside this article:
- How to calculate 3D product configurator ROI
- 3D product configurator ROI calculator
- The biggest drivers behind 3D configurator ROI
- 3D product configurator ROI case studies
- How to make the business case for a 3D product configurator
- A smart way to improve 3D product configurator ROI
Quick summary:
Not all 3D product configurators are created equal. Basic front-end systems handle small catalogs, while sophisticated ones may include enterprise visual CPQs (configure, price, quote). For that category, ROI comes from revenue lift, cost savings, and time savings, but the right model depends on your business. This guide shows how to calculate ROI for both e-commerce and manufacturer-led sales, with a calculator, worked examples, case studies, and a business-case slide deck. Benchmarks from the 3D Commerce Index Q1 2026 and a 2026 Provoke Insights study commissioned by 3D Cloud anchor the assumptions, including higher conversion and lower rendering costs.
How to calculate 3D product configurator ROI
To calculate 3D product configurator ROI, add the incremental gross profit from improved conversion and larger orders, cost savings from fewer returns and reduced labor, and time savings from faster workflows. Then subtract the cost of implementing and running the configurator each year.
That formula may sound simple, but the challenge comes with knowing which inputs to use and which gains are realistic to claim. The sections below cover each input, with worked examples for both an e-commerce brand and a manufacturer with a dealer network.
Start with the configurator ROI calculator: Enter your own figures and see the projected annual impact.
Product configurator costs to include
The main cost categories for a 3D product configurator are upfront implementation costs (asset creation, rules logic, integrations, and design) and ongoing costs (platform fees, updates, and training). Ranges vary widely based on product complexity and the depth of integration required.
Before building a cost model, it helps to understand what the investment actually covers. A properly built configurator has two distinct components: the customer-facing front end and the back-end rules engine and asset management layer, where every valid configuration is accounted for.
For example, a sectional sofa with multiple base options, fabrics, and finishes could produce millions of possible configurations. That back-end complexity is the primary reason implementation and management costs vary, and creating efficient workflows to manage configurators for highly complex products is also a primary source of downstream ROI.
The cost categories to include in a configurator ROI model are:
- 3D asset creation and componentization: Each distinct configurable component with a different physical shape needs a 3D model: arm styles, leg options, base configurations, and so on. Material variations including finishes, fabrics, and colors are typically handled through textures applied to that model in real time, so a sofa with 100 fabric options does not require 100 separate models. For brands without existing 3D assets, component modeling is often the largest upfront cost.
 Andy Macy, Director of 3D Content at 3D Cloud
"Product configurators are an efficient, cost-effective way to create all possible product variations from the fewest necessary components,” says Andy Macy, Director of 3D Content for 3D Cloud.
“Basic configurators might only require a single model, a few material options and very simple logic. Complex configurators contain large libraries of models and materials and require extensive logic.”
 Amanda Blaker, Lead Business Analyst at 3D Cloud
“I’ve seen product configurators with as few as four components and as many as 605, depending on complexity. For example, assets for a single office chair can range from $975 for a configurator with one configurable option to $15,750 for a configurator with 7 configurable options,” Blaker says.
“No two configurators are alike, but our clients purchase, on average, between 15 mesh components for office tables and seating configurators and 50 mesh components for casegoods and office desk configurators, resulting in an average asset cost of $3,000 to $10,000.”
- Rules logic: The rules engine defines every valid configuration a shopper can build. For a sectional sofa, that means defining compatibility between pieces. For example, a left-arm chaise cannot pair with another left-arm chaise, certain fabrics are only available on specific frame grades, and corner pieces require compatible adjacent modules. The more complex the product, the more work goes into building, testing, and maintaining those rules. When implementing a new solution you want to pick solutions that require little or no code to implement new rules. Underestimating this cost is the most common reason configurator projects run over budget.
- Integrations: Connecting the configurator to an existing e-commerce cart, PIM, ERP, CRM, or CPQ platform adds cost that varies substantially depending on the platform. Standard e-commerce integrations are generally well-supported. Custom ERP or dealer portal integrations require more scoping.
- UX and interface design: Off-the-shelf templates are faster and less expensive to deploy. Custom interfaces built to match a specific brand's design system typically cost more but may perform better on conversion.
- QA and testing: A rules-driven configurator with thousands of valid combinations needs structured testing before launch. This step is frequently underbudgeted.
- Analytics setup: Launching without proper instrumentation means there will be no way to measure the ROI that the investment is designed to generate. This is inexpensive to do upfront and costly to retrofit.
- Training: Code-free platforms allow non-technical employees to manage and update configurators without developer involvement, but any new platform requires onboarding.
- Ongoing platform fees and updates: SaaS fees, new product additions, material library updates, and performance tuning are recurring costs that belong in a multi-year model, not just Year 1.
 Jeff Cowgill, Chief of Staff & Executive Director, AI Strategy
Jeff Cowgill, Chief of Staff and AI Product Owner for 3D Cloud, offers these time and cost estimates for implementing 3D product configurators.
“When working with small-to-midsize enterprises, we see the best results with a phased rollout over 6 to 8 months, depending on overall catalog size that needs configurators built. This can be in the range of $50,000 to $100,00 in modeling and data entry costs to build all the assets, enter business rules, integrate with websites, and test,” Cowgill says.
He adds that configurator costs and ROI depend on the business, ranging from small retailers to major ones with extensive catalogs.
"The cost of implementing 3D product configurators can vary significantly based on industry vertical catalog size, product complexity, and number of reusable components,” Cowgill explains. “That said, our data show that the more catalog coverage a retailer or manufacturer can model, the more complete the experience and the higher the ROI.”
For simpler situations, implementation can go quickly. “For those picking off-the-shelf templates with simple branding (fonts, logos, colors), I have seen 9-12 weeks from kick-off to go live for their first configurator,” he says.
3D product configurator gains to include
The gains from a 3D product configurator fall into three categories: revenue lift, cost savings, and time savings. Which inputs matter most depends on the revenue, vertical (e.g., home furnishings vs. contract furniture) and whether a company is a retailer, manufacturer or vertically integrated.
Revenue inputs tend to dominate for e-commerce brands, while cost and time savings inputs tend to dominate for manufacturers and dealers with quote-driven sales processes.
When building an ROI model for an enterprise 3D product configurator investment, the inputs to include are:
- Revenue inputs: For retailers, configurators increase add-to-cart and conversion rates by giving shoppers the confidence to complete a purchase. They increase average order value by making upgrades and premium options easy to explore. For manufacturer and dealer models, the equivalent inputs are close-rate improvement and reduced discounting, both of which result from buyers entering later sales stages with fewer open questions.
- Cost savings inputs: Fewer returns result from shoppers receiving exactly what they configured. For manufacturers, bringing visualization in-house eliminates the cost of external rendering. For businesses with quote-driven sales, rules-driven configuration reduces errors that lead to rework, revisions, and goodwill discounts.
- Time savings inputs: Design iteration cycles shorten because stakeholders can react to a real-time visual rather than waiting for a revised rendering. Sales cycles compress because buyers enter later stages with fewer open questions. Quote turnaround time drops because configuration rules do the validation work that previously required specialist review.
Payback period vs. long-term ROI for 3D product configurators
For most 3D product configurator implementations, the investment begins to pay off within months rather than years. The gains from conversion lift, return reductions, and cost savings begin to accrue from the first month of deployment.
Finance teams typically want answers to two questions: how quickly the investment pays back, and what it returns over time. These are related but distinct, and conflating them is a common mistake in configurator business cases.
The payback period is the time it takes to recoup the initial investment. The metrics that move first are conversion rate, add-to-cart rate, and quote turnaround time, all visible within the first 60 to 90 days. Returns reduction and quoting error reduction compound over time as teams learn the new system.
Long-term ROI is the total value generated over the platform's useful life, typically modeled over three years. Because the gains are recurring, a business case built only on Year 1 numbers systematically understates the investment's value.
A strong business case presents both figures. CFOs want the payback period to approve the investment and the three-year model to understand its strategic value.
Example ROI calculation for an e-commerce brand
The following e-commerce ROI calculation uses conservative assumptions anchored to published benchmarks and A/B tests to create a model finance teams can review and stress-test. The inputs below match those used in the 3D product configurator ROI calculator embedded below, so numbers can be carried directly across.
All inputs are illustrative. Organizations should substitute their own figures before presenting this model internally.
Scenario: Mid-market DTC furniture brand
| Input | Illustrative value |
| PDP views (yearly) | 1,500,000 |
| Usage rate | 0.13 (13%) |
| Avg add-to-cart rate | 0.04 (4%) |
| Average cart value | $800 |
| Add-to-cart rate uplift | 0.35 (35%) |
| Contribution margin | 0.40 (40%) |
The conservative assumptions applied to this scenario are as follows:
| Driver | Assumed value | Source |
| Usage rate | 13% | 3D Commerce Index Q1 2026 average for product configurators |
| Add-to-cart rate uplift | 35% | Modeling assumption informed by the 3D Commerce Index Q1 2026 sectional-catalog A/B test, which reported a 41% conversion lift |
| Cart conversion rate | 30% | Midpoint of calculator slider range |
The Year 1 output based on those inputs is as follows:
| Metric | Value |
| Sessions engaging with configurator | 195,000 |
| Incremental cart value | ~$2.18M |
| Projected annual incremental revenue | ~$654,000 |
The key variable is traffic volume. A brand with 500,000 annual PDP views will see proportionally smaller dollar returns even if the percentage lifts are identical, which is why traffic is a critical input when assessing whether a configurator makes sense for a specific product line.
Example ROI calculation for a furniture manufacturer or dealer-led sales process
For manufacturers and dealers, ROI centers on operational gains rather than conversion lift. The following scenario is informed by a Provoke Insights business impact study commissioned by 3D Cloud. The study, published in January 2026, was based on research with decision-makers at major office and contract furniture manufacturers. Volume and labor rate inputs below are illustrative.
Scenario: Mid-size contract office furniture manufacturer with a dealer network
| Input | Illustrative value |
| Annual external rendering spend | $420,000 |
| Visualization team size | 6 FTEs |
| Avg. hours per sales visualization request | 4.5 hours |
| Blended, fully loaded labor cost | $85/hour |
| Driver | Assumed improvement | Source |
| Per-image rendering cost reduction | -80% | Provoke Insights Business Impact Study |
| Visualization output increase (same headcount) | +40% | Below the ~50% reported in the study |
| Dealer visualization time savings | -50% | Within the 50-55% range in the study |
| Metric | Value |
| Annual rendering cost savings | ~$336,000 |
| Labor savings from dealer workflow efficiency | ~$163,000 |
| Value of avoided FTE | ~$75,000 |
| Total annual gain | ~$574,000 |
This scenario does not include pipeline and revenue benefits, such as the $1 million in bill-of-materials value generated during early buyer evaluation reported in the Business Impact Study. Those gains are real but belong in the optimistic case rather than the base case.
3D product configurator ROI calculator
Try this product configurator ROI calculator as a starting point to gauge your company’s situation. Each use case has unique aspects, so we’ve also included a sensitivity analysis for the projected annual impact.
| Cart Conversion Rate | Incremental Revenue |
|---|
3dcloud.com
The biggest drivers behind 3D product configurator ROI
The biggest factors behind 3D configurator ROI are add-to-cart rate lift, conversion rate lift, average order value improvement, reduced return rate, visualization cost savings, and faster sales and design cycles. The evidence comes from a mix of performance benchmarks, controlled tests, case studies, and commissioned research.
Revenue drivers for 3D product configurators
The primary revenue drivers for 3D product configurators are add-to-cart rate lift, conversion rate increase, average order value improvement, and, for B2B and dealer models, higher close rates and reduced discounting.
Here’s a closer look at revenue drivers for 3D configurators:
- Add-to-cart rate lift or conversion rate lift: Add-to-cart rate and conversion rate are related but distinct: add-to-cart measures the share of sessions that commit to a configuration, while conversion measures completed purchases. Both move in the same direction when a configurator is working. Shopify has reported that products with 3D and AR content see an average 94% higher conversion rate than those without.The 3D Commerce Index Q1 2026 provides controlled evidence: in a 50/50 A/B test across 200,000 users, shoppers who engaged with a sectional configurator converted at a 41% higher rate than those who did not, with an 8.6% lift in revenue across the sectional catalog.
- Average order value lift: The 3D Commerce Index Q1 2026 shows product configurators averaging $1,500 in order value and modular configurators averaging $2,700, with best-in-class implementations reaching $10,000 AOV. The 3D Cloud 2026 Furniture Shopping Trends Study found that nearly one in three configurator users spent more than originally planned, compared to just 17% of non-users.
- Upsell and cross-sell revenue: Configurators that surface compatible accessories, premium finishes, or higher-tier options within the configuration flow capture upgrade revenue that a standard product page rarely reaches.
- Higher close rates and reduced discounting: For manufacturers and dealers, buyer clarity reduces the rounds of revision that typically lead to discounting. Nucleus Research's 2025 CPQ market analysis found that organizations investing in modern configure-price-quote capabilities report shortened approval cycles and a reduction in revenue leakage of 2 to 4%.
Cost-saving drivers for 3D product configurators
The primary cost-saving drivers for 3D product configurators are reduced return rates, elimination of visualization and rendering costs, reduced quoting errors, and headcount efficiency. Cost savings tend to be the dominant ROI story for manufacturers and dealers, though return rate reduction is significant for e-commerce brands as well.
The cost-saving drivers to quantify are:
- Return rate reduction: Shopify has reported that 3D and AR visualization can reduce return rates by up to 40%. The 3D Commerce Index Q1 2026 documents this at the client level: A major upholstered furniture manufacturer saw a 25% reduction in returns after deploying a product configurator with AR across more than 1,300 dealers, and a major vertically integrated home furnishings company achieved the same 25% reduction through 3D and AR integration.
- Visualization and rendering cost elimination: The Provoke Insights Business Impact Study commissioned by 3D Cloud in January 2026 found that major office furniture manufacturers reduced per-image rendering costs from $100 to $200 down to approximately $20 after moving visualization in-house, an 80 to 90% reduction. One manufacturer saved $400,000 annually as a result.
- Quoting error reduction: A rules-driven configurator makes invalid configurations impossible to submit, eliminating the downstream costs of incorrect orders. Nucleus Research's 2025 CPQ market analysis found a 20 to 30% reduction in quoting errors.
- Headcount efficiency: The Provoke Insights Business Impact Study found that major manufacturers increased visualization output by approximately 50% without adding headcount, with one team of 5.5 people supporting approximately 110 dealers and hundreds of internal users. Each avoided full-time equivalent role represents approximately $75,000 in annual savings.
- Asset reuse across channels: A single 3D asset created for a configurator can simultaneously power a room planner, WebAR experience, product renders, 360° spins, and virtual reality applications.
Time-saving drivers for 3D product configurators
The primary time-saving drivers for 3D product configurators are faster buyer decision-making, shorter sales cycles, faster quote generation, and a quicker path from configuration to order. Time savings tend to be most visible in manufacturer and dealer workflows.
The time-saving drivers to quantify are:
- Faster buyer decision-making: The 3D Cloud Contract Interiors Product Configuration Trends Study 2025, conducted by Provoke Insights among 100 commercial designers, found 100% satisfaction among those using 3D configurators, with designers citing reduced back-and-forth, fewer revision rounds, and faster client approvals as the primary benefits. For consumer brands, the same dynamic plays out on the product page: shoppers who can see their exact configuration in real time spend less time deliberating across multiple sessions or store visits.
- Shorter sales cycles and faster quote generation: The Provoke Insights Business Impact Study found that major manufacturers saved an average of three days per project in design iteration and approval time, with dealer sales visualization time dropping 50 to 55%. Nucleus Research's 2025 CPQ analysis found approval cycles shortened by 15 to 20%.
- Earlier path to order: Fully integrated manufacturers in the Provoke Insights study reported that 17 to 20% of total website traffic engaged with 3D visualization tools before reaching the sales team, with one manufacturer tracking a 65% increase in new design projects and $1 million in bill-of-materials value generated during early evaluation.
Which products get the best ROI with configurators?
Upholstered furniture, office seating, cabinetry, modular systems, boats, bikes, automobiles, industrial equipment, and luxury goods tend to get the strongest ROI from 3D configurators. What they share is high variant complexity, visual customization that directly drives purchase decisions, and price points where purchase uncertainty creates real conversion and return risk.
The product characteristics that tend to generate the strongest configurator ROI are:
- High variant complexity: Products with many combinations of materials, finishes, sizes, or components benefit most because the configurator replaces a visualization problem that static imagery cannot solve at scale. This includes upholstered furniture, office seating, cabinetry, closet and storage systems, decking, modular shelving, boats, bikes, and industrial or commercial equipment with extensive option sets.
- Premium price points: Higher AOV products carry more purchase uncertainty, more return risk, and more value per conversion gained. Automotive, luxury goods, jewelry, high-end outdoor gear, and marine products share this characteristic with furniture and contract interiors.
- Visual customization as a purchase driver: Products where appearance directly influences the buying decision see stronger lift than products where customization is primarily functional. Apparel, footwear, accessories, kitchens and baths, and any product sold in a wide range of materials, colors, or finishes falls into this category.
- Complex configuration rules: Products with interdependent components, compatibility constraints, or made-to-order manufacturing requirements benefit from the rules engine as much as the visual experience. Modular office systems, sectional sofas, HVAC systems, and engineer-to-order industrial products all fall here.
Best-fit business models for 3D configurators
The business models where 3D configurator ROI tends to be strongest are DTC e-commerce brands, dealer and distributor networks, made-to-order manufacturers, and B2B organizations with complex quoting processes.
The ROI profile looks different in each model:
- DTC e-commerce brands: ROI is driven by add-to-cart rate lift, AOV improvement, and return rate reduction. The configurator replaces the imagination gap that static product pages leave open, particularly for high-consideration purchases where shoppers would otherwise visit a showroom or delay a decision.
- Dealer and distributor networks: ROI compounds across the network because a single asset investment supports every dealer simultaneously, giving each location self-service visualization capability without individual investment or specialist support.
- Made-to-order brands: The configurator serves as the primary selling interface, capturing order intent with precision and reducing the misalignment between what a customer expects and what gets built.
- Manufacturers with complex quoting: Time and cost savings tend to dominate: faster quote generation, fewer errors, and shorter approval cycles compound significantly across high volumes of dealer and sales interactions.
When a 3D configurator may not be the right investment
A 3D product configurator is not the right investment for every product or business. The ROI case weakens significantly when the core conditions that make configurators valuable are absent.
The situations where a configurator is unlikely to justify the investment are:
- Low variant complexity: If a product comes in three colors and two sizes, a dropdown menu solves the problem.
- Low traffic volume: A meaningful add-to-cart rate lift generates real revenue at 100,000 monthly sessions and modest revenue at 5,000. The fixed cost of implementation needs sufficient traffic to recover.
- Low-margin products: When gross margin is thin, revenue gains may not cover implementation and platform costs within a reasonable payback period.
- Low customization demand: If shoppers are not making purchase decisions based on visual customization, a configurator addresses a problem the customer does not have.
How to maximize ROI from a 3D product configurator
Maximizing ROI from a 3D product configurator depends less on the decision to invest and more on how the implementation is executed. It requires the right product line, a well-designed configurator, integrated platforms, and smart measurement.
Follow these four steps to maximize the ROI:
- Start with the right product line. The pilot product should have high variant complexity, strong traffic volume, a premium price point, and clear purchase friction such as high bounce rates, high return rates, or frequent pre-purchase support requests. Starting with a product that is too simple or too low-traffic produces results that understate the platform's potential and make internal expansion harder to justify.
- Design the configurator for conversion. A technically functional configurator that is poorly designed for the purchase flow will underperform regardless of the product it serves. The decisions that most directly affect conversion are progressive disclosure of options, real-time pricing updates, mobile-first layout, save and share functionality, and a clear path to purchase at every stage of the configuration.
- Connect it to the rest of the stack. A configurator that operates in isolation creates friction downstream and limits the data available to measure performance. The integrations that most directly affect ROI are the e-commerce cart, PIM, ERP or CPQ for manufacturers and dealers, CRM for B2B lead capture, and analytics for performance measurement.
- Measure the right metrics after launch. The core metrics to track from day one are interaction rate, configuration completion rate, configurator versus non-configurator conversion rate, average order value for configured versus non-configured orders, and return rate for configured versus non-configured orders. For manufacturers, add quote turnaround time, quote accuracy rate, and dealer self-service rate. The 3D Commerce Index Q1 2026 provides benchmark interaction rates of 13% for product configurators and 13.9% for modular configurators as a reference point for evaluating early performance.
3D product configurator ROI case studies
The following case studies illustrate how configurator ROI plays out across different business models: a manufacturer selling through a dealer network, a DTC retailer consolidating a fragmented 3D ecosystem, and a multi-brand enterprise using configurators to streamline dealer quoting.
- Flexsteel: scaling customization across 1,300+ dealers Flexsteel, an Iowa-based upholstered furniture manufacturer founded in 1893 and sold through more than 1,300 dealers nationwide, needed to meet rising consumer expectations for product customization without adding internal complexity. The company deployed over 400 configurators across consumer and dealer channels in under a year, managed by a single non-technical marketing specialist. The platform now delivers 36,000+ monthly sessions, a 2:38 average session duration, a 6.9% BOM download rate, and a 4.9% share rate. See the case study on Flexsteel’s 3D configurator deployment.
- CITY HOME: unifying 3D operations to drive sales CITY HOME, a top 20 U.S. furniture retailer with more than 30 showrooms across Florida, was managing multiple 3D vendors and disconnected workflows, which slowed content updates and made it difficult to scale. After consolidating onto a single platform, the company saw a 46% lift in add-to-cart rate when configuration is an option, an 18% AOV lift for customers who use the "Build Your Own" experience, and a 10% increase in revenue per session on configurable collection pages, with an average session duration of 4.41 minutes. Here is the case study on how CITY HOME streamlined its 3D operations.
- HNI Corporation: streamlining dealer specification and quoting HNI Corporation, a NYSE-listed office furniture enterprise with more than 7,000 employees and brands including HON, Allsteel, and Kimball, replaced its 2D configurator with an integrated 3D configuration and quoting system connected directly to its dealer portal and ordering systems. Over the past year the platform has generated more than $60 million in estimated quote value, a 60% close rate on requested quotes, 300,000+ sessions, and 135,000+ unique users across three brands. See the case study on how HNI uses 3D product configurators.
How to make the business case for a 3D product configurator
Making the business case for a 3D product configurator requires translating the ROI model into a narrative that addresses the concerns of finance, operations, and senior leadership simultaneously. The case needs to show not just that the investment pays back, but that the risk of inaction is higher than the risk of moving forward.
The steps to prepare and present the business case are:
- Start with the problem, not the solution. Lead with the business pain: high return rates, low online conversion relative to in-store, long sales cycles, costly quoting errors, or losing ground to competitors who already offer configurators. Quantify the current cost of the problem before introducing the configurator as the answer.
- Build a conservative ROI model. Use the inputs from the calculation section of this article and anchor every assumption to a cited source. A model that finance can interrogate and stress-test is more persuasive than one with aggressive assumptions and no methodology.
- Show the payback period prominently. CFOs approve investments faster when the payback period is short and clearly demonstrated.
- Address implementation risk directly. Acknowledge the costs, the timeline, and the dependencies. A business case that does not surface risks loses credibility when stakeholders raise them in the room.
- Close with a pilot proposal. Rather than asking for full rollout approval, propose a scoped pilot on a single product line with defined success metrics and a decision gate. This lowers the approval threshold and lets the results make the expansion case.
Slide deck to make the business case for a 3D product configurator
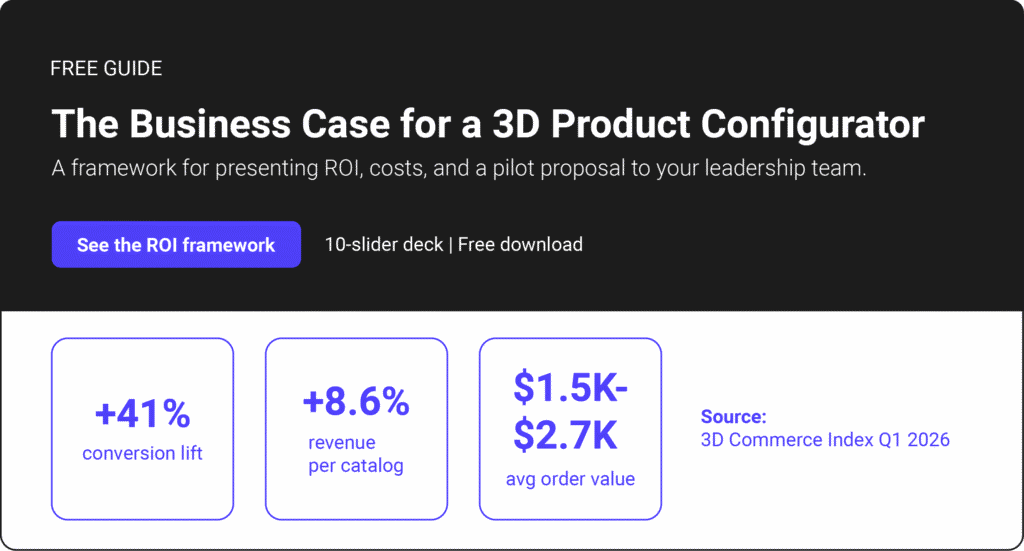
The 10 slides provide the fundamentals, and there are places to add your organization’s details. You can easily copy it into your organization’s slide theme if you have one.
How to launch a low-risk pilot project for a product configurator
The lowest-risk way to launch a 3D product configurator is to start with a single product line, define success metrics before launch, and set a decision gate that determines whether results justify expansion.
The steps to a sound pilot are:
- Choose the right product line: Apply the same criteria used to assess configurator fit: high variant complexity, strong traffic, premium price point, and evidence of purchase friction such as high return rates or frequent pre-purchase support contacts. Avoid starting with a product that is too simple to move the needle or too obscure to generate statistically meaningful data.
- Set a tight scope: Limit the pilot to one product family, a defined SKU count, and the integrations strictly necessary for launch — cart, basic analytics, and PIM at minimum. Scope creep is the most common reason pilot timelines extend and costs rise before results are visible.
- Instrument before launch: Define and implement the analytics tracking before the configurator goes live, not after. The metrics that matter are interaction rate, configurator versus non-configurator conversion rate, average order value for configured orders, and return rate for configured orders. For manufacturers, add quote turnaround time and dealer self-service rate.
- Run it long enough to be meaningful: Ninety days post-launch is the minimum for furniture and home categories where purchase cycles are long and return data takes time to mature. Shorter measurement windows produce noisy results that are hard to act on.
- Set a decision gate in advance: Before launch, define the specific thresholds that will trigger expansion: for example, a 15% or greater configurator conversion lift and a 10% or greater reduction in returns within 90 days. Having the gate agreed on before results arrive removes the subjectivity from the expansion decision.
How 3D Cloud improves ROI for 3D product configurators
3D Cloud product configurators improve ROI through faster deployment, code-free management, and a reusable 3D asset foundation that compounds in value across every channel and application it supports.
That foundation is the 3D Cloud Digital Asset Management System, which centralizes the creation, management, and publishing of every 3D asset across configurators, room planners, WebAR, and other commerce applications. It is what makes asset reuse possible at scale — and what separates a configurator investment that pays back once from one that keeps paying back as new channels and use cases are added.
 Diana Glattly, CEO and Founder of Cypher
Diana Glattly, CEO and Founder of Cypher, describes its value like this: “The 3D Cloud Digital Asset Management System is essential for creating and managing complex configurators for major enterprise clients in the office and home furnishings verticals.
The system comprises sophisticated tools designed to build, test, and maintain all of the intricate 3D assets and large volumes of data required by highly configurable products. I'm continually impressed as we push limits and break records with complexity.”
The ways 3D Cloud specifically improves configurator ROI are:
- Faster time to launch. 3D Cloud implementations typically launch in 10 to 12 weeks, accelerating the path to the conversion lift, return reduction, and cost savings the ROI model depends on.
- Code-free, self-service management. Non-technical employees can add products, swap materials, and update configurations without developer involvement, eliminating a recurring operational cost that erodes ROI on less self-sufficient platforms.
- Reusable 3D assets across every channel. A single asset created for a configurator simultaneously powers WebAR, room planners, product renders, 360° spins, and virtual reality, making each subsequent use of the asset more economical than the last. The asset reuse model is what converts a one-time configurator investment into a compounding platform advantage.
- Phased rollout from pilot to scale. The platform supports starting with a single product line and expanding based on results without re-platforming.
For organizations ready to move from model to implementation, the next step is a conversation with 3D Cloud.